Storing Map Tiles for Offline Use: HTML to JPG in Jupyter Notebooks
- H-Barrio
- Jun 15, 2021
- 5 min read
To finish exploring the possible uses for geographic source data for the obtention of intelligence (covered in this post and this post), we will store some map tiles that may be of interest. The reasons for wanting these tiles stored locally are multiple, the main two: to access the image of some locations without internet access and speed of access to these images.
The notebook for this post is at the end, after our contact information.
We will select a few images to store using what we think is the simplest process. And simplicity is fundamental in this case as storing map tiles locally requires saving screenshots from images served inside HTML pages; working with HTML to extract information that is not textual while using Python open-source tools can be quite challenging, even frustrating.
First of all, let's grab some points of interest. Continuing with our transportation topic, we will use our previously cleaned data gems taken from the Spanish rail network authority, ADIF, Web Features Service. The file, if you need it, is here:
As usual, this CSV file can be imported easily using pandas, passing both index columns and header options. The CSV file, as it usually is, contains fields that are supposed to be text, so the best way to import them without mistakes (as missing leading zeroes in identifiers) is to set the data type (dtype) to string (str) explicitly. As the coordinates column ('coords') will be numeric, we can transform it just after importing, splitting the blank space, and casting the strings into a list of floats:
import pandas as pd
points = pd.read_csv('PKTeoricos_ADIF.csv',
                     index_col=0,
                     header=0,
                     dtype=str)
points['coords'] = points['coords'].apply(lambda x: [float(n) for n in x.split(" ")])
The shape of the data frame is this:
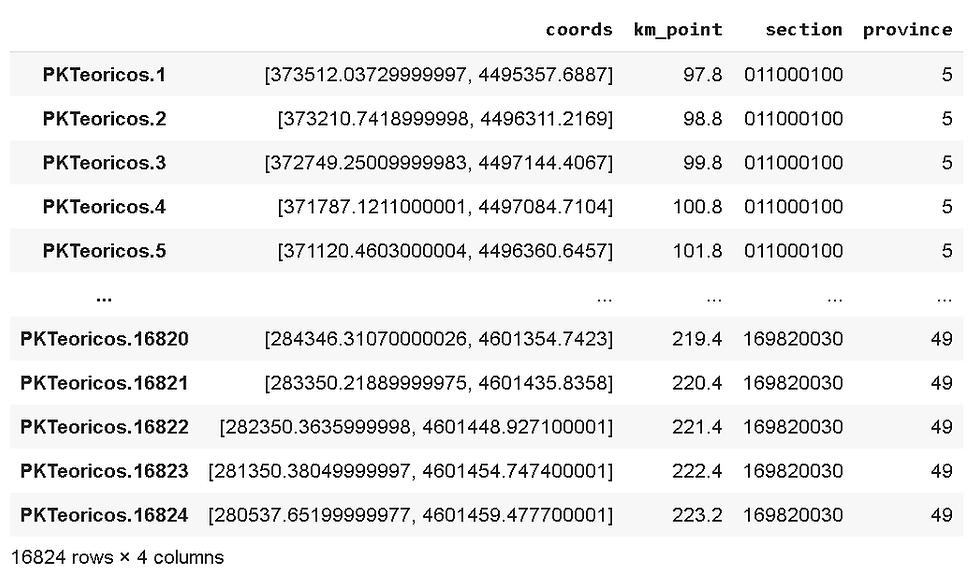
We will bring in the pyproj module, installing it if necessary, and proceed to the transformation of the projections so that we can plot our coordinate points in a map. There are too many points for a demonstration trial; we will sample just 10 random points from the whole set with .sample():
!pip install pyproj
from pyproj import Proj, transform
# Coordinates transformation for this area:
inProj = Proj(init='epsg:25830')
outProj = Proj(init='epsg:4326')
test_points = points.sample(10)
test_points['EPSG4326_coords'] = test_points['coords'].apply(lambda x: transform(inProj,outProj,x[0],x[1]))
We are ready to plot these points using folium. This code is taken from our previous post and directly plots the satellite map using ESRI satellite image tileset:
import folium
m_init = False
for i, p in test_points.iterrows():
    x, y = p['EPSG4326_coords']
    p_name = 'PK - ' + str(p['km_point'])
 if not m_init:
        map = folium.Map(location= [y,x] , zoom_start=14)
        folium.Marker(location=[y,x], popup=p_name,
                      icon = folium.Icon(color='yellow')).add_to(map)
        m_init = True
 continue
    folium.Marker(location=[y,x], popup=p_name, icon = folium.Icon(color='yellow')).add_to(map)

tile = folium.TileLayer(
      tiles = 'https://server.arcgisonline.com/ArcGIS/rest/services/World_Imagery/MapServer/tile/{z}/{y}/{x}',
      attr = 'Esri',
      name = 'Esri Satellite',
      overlay = False,
      control = True
      )
tile.add_to(map)
map
The result, using the provided ADIF rail network infrastructure dataset, should be something similar to this image:
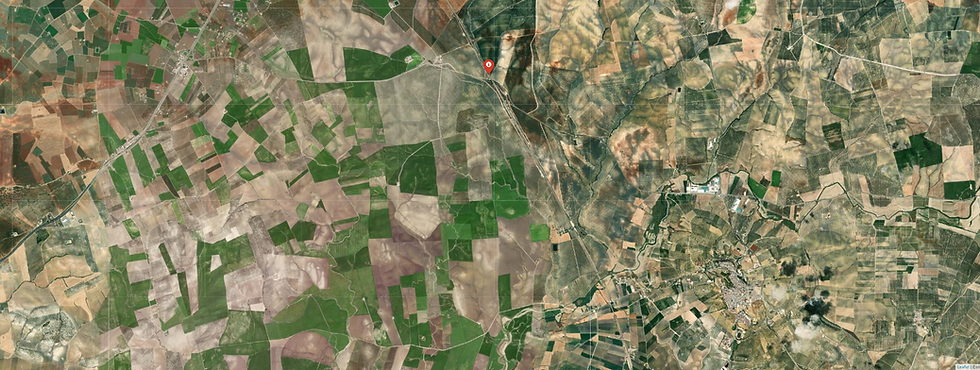
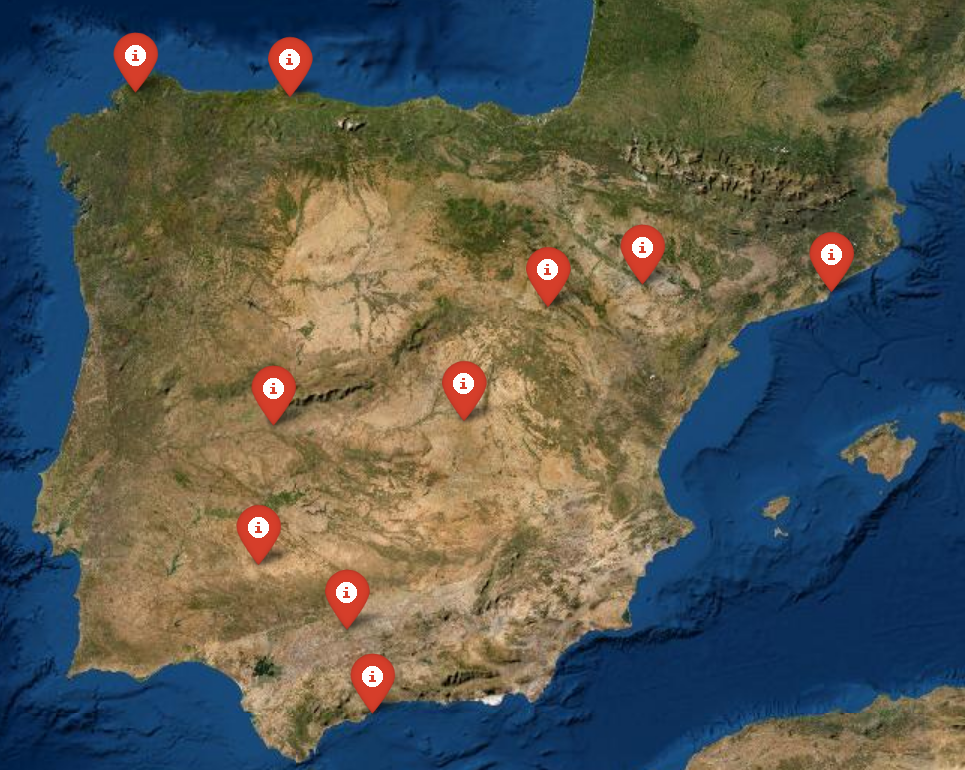
The image above is one of the images we want to store locally. These images can be later accessed by a location identifier. This is convenient only if access to the mapping service is done in the same general area or the same areas. If the system requiring mapping is an edge device with limited storage or connection access, a minimal subset of map tiles relevant to the task can improve performance and reduce costs. The size of the satellite imagery, similar to this ESRI imagery we are using, can take 200GB of storage for the complete planet. This is for the complete globe and multiple zoom settings. If your system can work with a small set of zoom levels and is constrained to a known area, several MB updated every week can give the same mapping location results. The areas we have captured are randomly distributed around Spain, on locations related to the railway network:
To create the set of images for our 10 samples, we can iterate over the contents of the points data frame using iterrows and save each of the generated maps as HTML using folium´s own map object save method. We first create the directories to hold both the map HTML files and the images that we will generate in the last step:
#Create KM points map images:
import os
dir_maps = 'maps_html/'
dir_images = 'stored_images/'
dirs = [dir_maps, dir_images]

for d in dirs:
 if not os.path.isdir(d):
    os.mkdir(d)

for i, r in test_points.iterrows():
    x, y = r['EPSG4326_coords']
    map_loc = folium.Map(location= [y, x] , zoom_start=15)
    p_name = r.index
    folium.Marker(location=[y,x], popup=str(p_name), icon = folium.Icon(color='yellow')).add_to(map_loc)
    tile.add_to(map_loc)
    map_loc.save(dir_maps+str(i)+'.html', 1)
Listing the contents of the "maps_html" folder serves to verify that our 10 sample web pages are there. Although these files can be opened normally and locally; they will generate a call to the map tiles in the corresponding remote server in order to render the map:
html_maps = os.listdir('maps_html/')
html_maps
['PKTeoricos.8469.html', 'PKTeoricos.12196.html', 'PKTeoricos.10890.html', 'PKTeoricos.3613.html', 'PKTeoricos.7911.html', 'PKTeoricos.14338.html', 'PKTeoricos.11473.html', 'PKTeoricos.10498.html', 'PKTeoricos.13308.html', 'PKTeoricos.1822.html']And now, the real transformation. Many tools will save a web page display as an image, naming two: Selenium and html2image. The challenge with taking a screenshot from a webpage is that the webpage has to be rendered by a web browser beforehand. If you have full control over your system, both packages will do their job; html2image might be a little faster. If you have no full control over the system (as in the Google Colab environment), the best method we have found is to use the selenium installation that comes with the Kora package. We will need to install it along with time and OpenCV-cv2.
!pip install kora -q
import time
from kora.selenium import wd
import cv2
Then, looping over all the files in our HTML folder, we can generate the images of the maps we need:
SLEEP = 5
for f in html_maps:
  wd.get('file:///content/'+dir_maps+f)
  time.sleep(SLEEP)
  img_file = dir_images+f.strip('.html')+'.png'
  wd.save_screenshot(img_file)
  img = cv2.imread(img_file)
  img = img[0:600, 0:800]
  cv2.imwrite(img_file.replace('png', 'jpg'), img)
The process is straightforward, although it needs a couple more tricks.
First, the web page's rendering will go through its own process, and Python will not necessarily wait for the complete loading of the page before saving the screenshot with "wd.save". SLEEP is a constant that will delay the saving by the number of seconds we specify using the "time. sleep" function. 5 seconds may be too much; it depends on too many factors to be easily optimized. We recommend just taking one image at the 1-second delay and check if the render was completed before the screenshot is taken. The web-driver (wd) will only output .png files, so we need to transform the output to whatever our needs are.
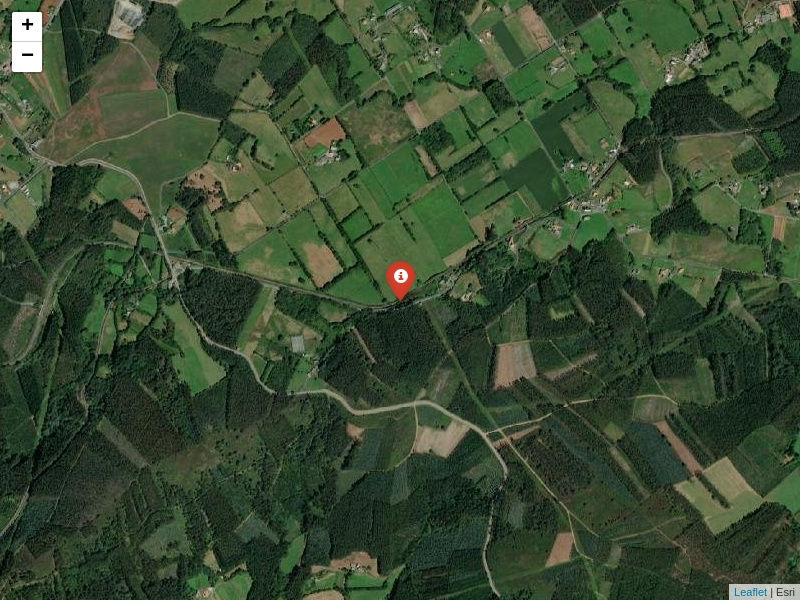
Second, the interest area is the top-left 800x600 pixels of the image (100% folium map size); we use OpenCV to crop it and store it as a jpg file. The quality of the image is quite good; very few eyes would notice the difference, for quasi-static purposes, between this and a properly rendered map image:
The same map, with SLEEP = 0.01, improperly rendered:
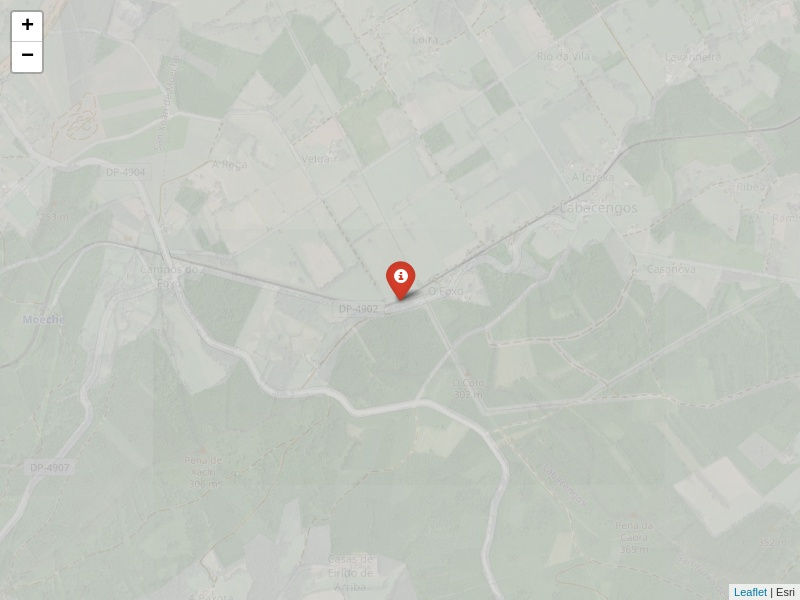
It is now a matter of choice. Do you need full maps? Can you run overnight/maintenance period map tile saving and updating scripts? Do you expect constant connection problems? In our case, the stored maps serve as a backup in case of network connection loss, and we found it useful and not too taxing to implement in a production environment with periodic downtime.
If you require quantitative model development, deployment, verification, or validation, do not hesitate and contact us. We will also be glad to help you with your machine learning or artificial intelligence challenges when applied to asset management, automation, or intelligence gathering from satellite imagery.
Link to the Google Colab notebook.
Comentarios